Xing XingSeptember 12, 2025
Tag: Pharmacopoeia , statistical , method validation , data reporting
The Chinese Pharmacopoeia 2025 has introduced significant revisions to the 9101 Guidelines for Validation of Analytical Methods further promoting the application of statistics in analytical method validation. How to use statistics for reporting validation data has become a challenge to be solved by analysts.
This article will interpret the data reporting requirements for the two key performance indicators "Accuracy and Precision" in analytical method validation. It will also provide a detailed explanation on how to use traditional Excel software for statistical analysis of validation data, aiming to assist industry colleagues in implementing the regulatory requirements promptly.
The Chinese Pharmacopoeia 2025 requires that: All precision tests should report the standard deviation (SD), relative standard deviation (RSD) (coefficient of variation, CV), and an appropriate 100 (1-α)% confidence interval (CI) or other reasonable statistical interval. Accuracy test results should be reported as the average recovery of the analyte of known amount added to the sample, along with a reasonable 100 (1-α)% CI.
Both standard deviation (SD) and relative standard deviation (RSD) are used to describe the dispersion between test results. The calculation formulas are as follows:
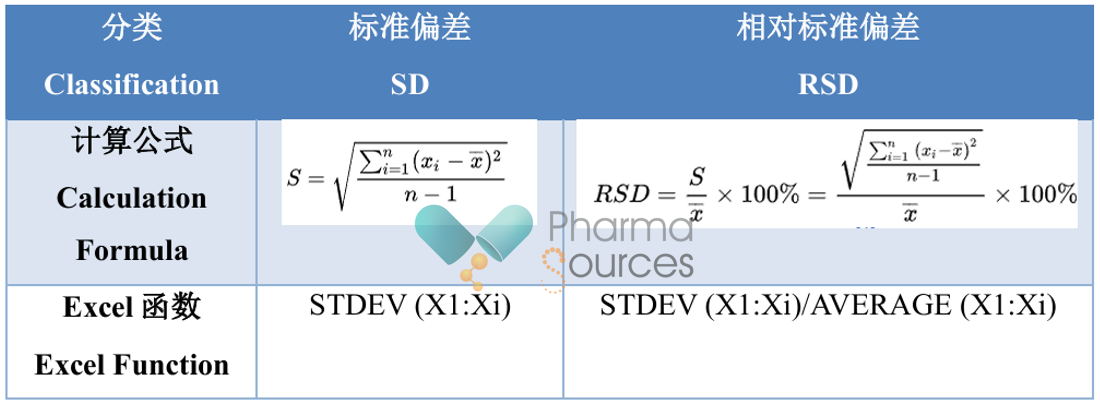
The α represents the significance level, used to measure the probability of error in the results during a hypothesis test. The smaller the α, the smaller the probability of error. Typically, α is set at 0.05 because statistically, if the probability of an event occurring is only 5%, it is considered unlikely to happen.
Confidence Level = 100(1 - α)%. When α is 0.05, the confidence level is 95%, meaning: one can be 95% confident that the true parameter value lies within the calculated CI.
A confidence interval consists of a lower confidence limit and an upper confidence limit, indicating the range within which the population parameter is likely to occur at a certain confidence level.
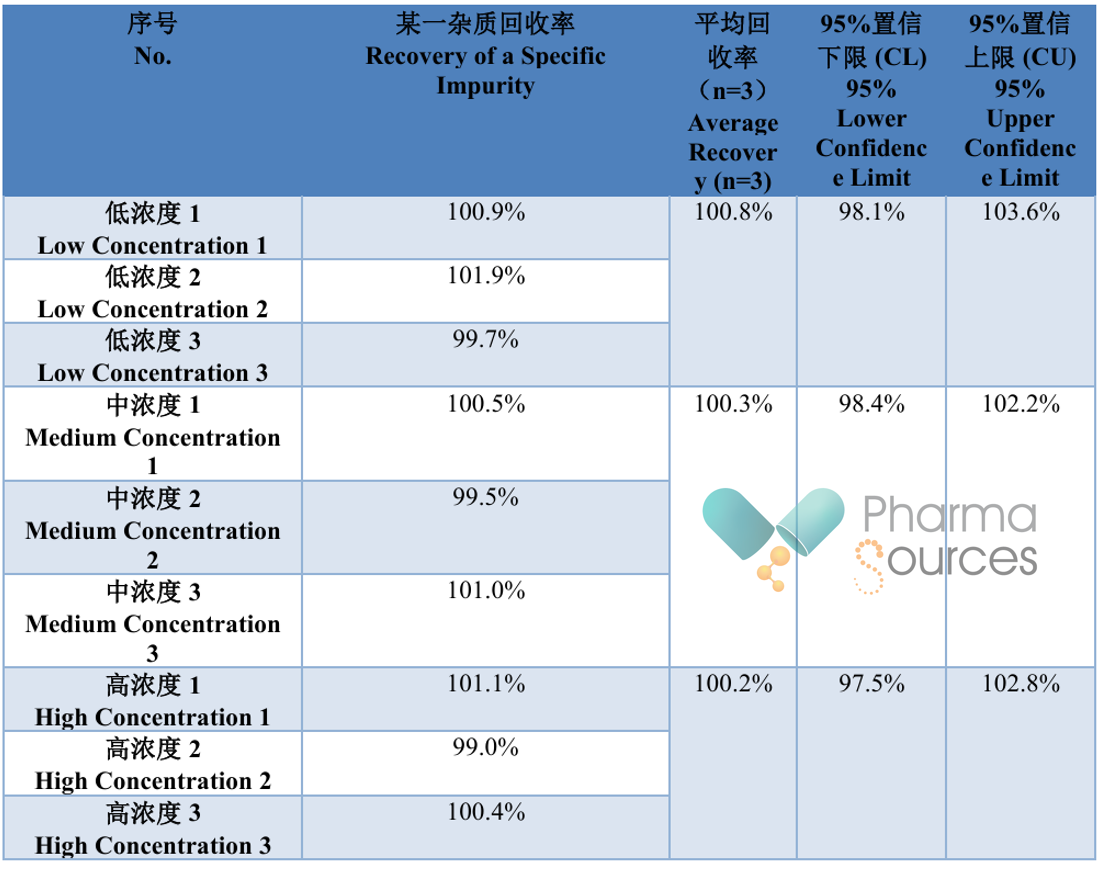
In analytical method validation, the sample size for repeatability is typically 1×6, and for accuracy, it is typically 3×3 or 1×6, all belonging to small sample data (n<20). Therefore, the t-distribution should be used to calculate the CI. The formula is as follows:

Wherein: df denotes degree of freedom n-1;
t1-α/2, df is the 1-α/2 quantile of the t-distribution with df as the degree of freedom and 1-α as the confidence level. When calculated using Excel, the function is TINV(α, df).
When √n is calculated using Excel, the function is SQRT(n).
Table 1.4.1 Repeatability Results (Example)
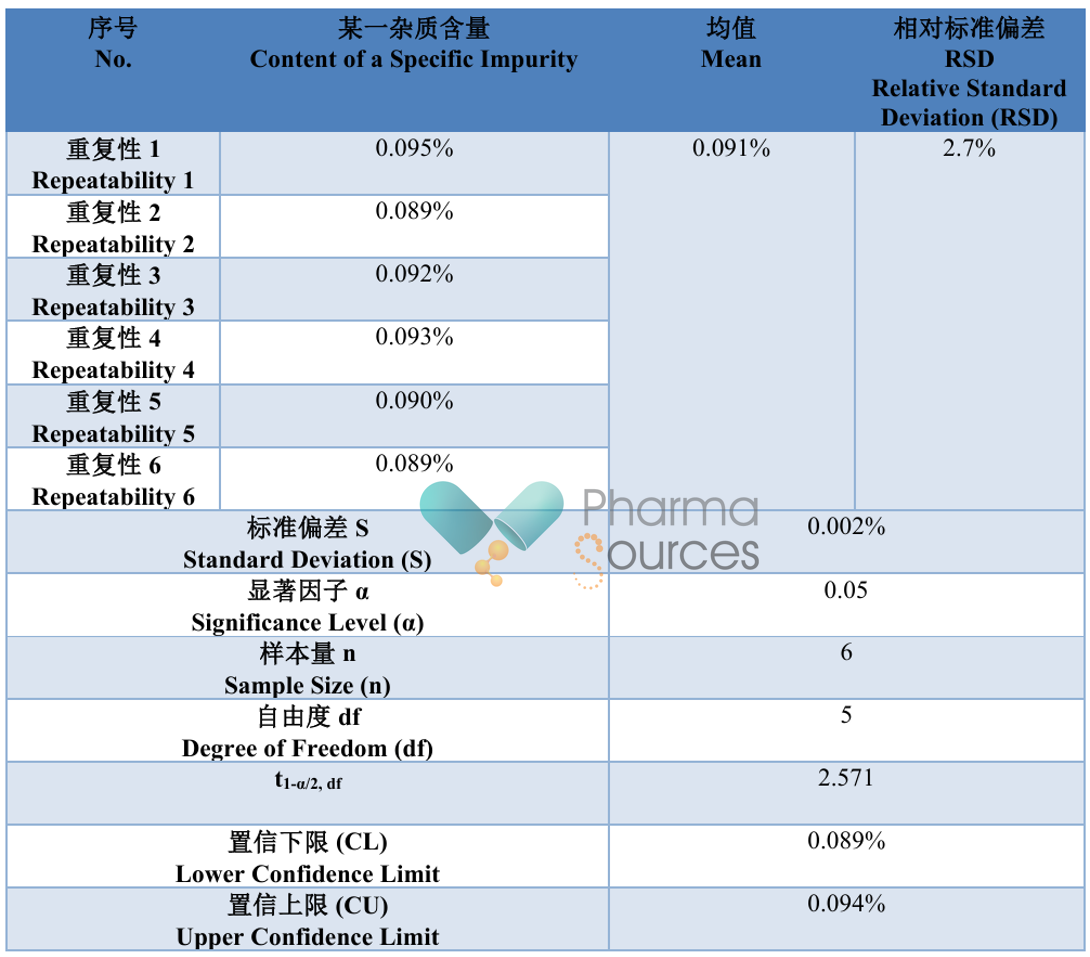
Table 1.4.2 Accuracy Results (Example)
The Chinese Pharmacopoeia 2025 proposes that: Accuracy and precision can be evaluated jointly, and statistical methods may include prediction intervals, tolerance intervals, or confidence intervals, or other reasonable statistical methods
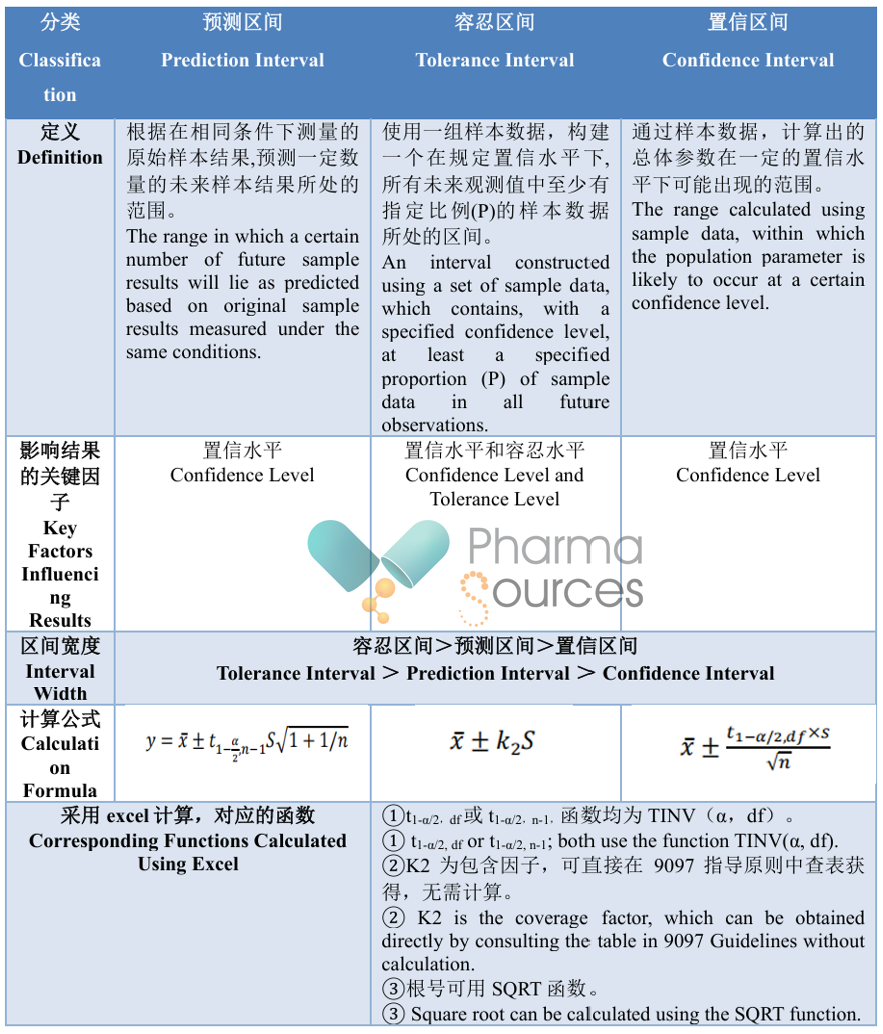
As can be seen from the table above, the combined evaluation of accuracy and precision essentially involves performing multiple determinations of the sample to calculate the range within which the results are likely to occur. When this range is acceptable, the method can be considered accurate. Therefore, the prerequisite for the combined evaluation of accuracy and precision is that the true value of the sample or an acceptable reference value has been obtained.
Test design for combined evaluation is as follows: ① Assay: For an active pharmaceutical ingredient (API), the assay can be performed multiple times using a reference standard or test article of known purity; For a preparation (formulation), the assay can be performed multiple times by adding an analyte reference standard of known amount to the blank excipients. ② Impurity Determination: It can be performed multiple times by adding an impurity reference standard of known amount to the API or preparation.
Astute readers will notice that the test design concept for the combined evaluation is consistent with that of the separate accuracy test, differing only in the calculation method used for result determination, and it omits the precision test!!! This is because precision does not necessarily imply accuracy, but accuracy implies precision. The combined evaluation characterizes both the accuracy and precision of the method simultaneously through sufficient accuracy test. To ensure the reliability of the "combined evaluation", the sample size should be ≥10.
Data Example: Combined validation of accuracy and precision for an assay method of an API. Take a reference standard with a known purity of 99.8%, follow the procedure for preparing the test solution to prepare ten replicates in parallel.
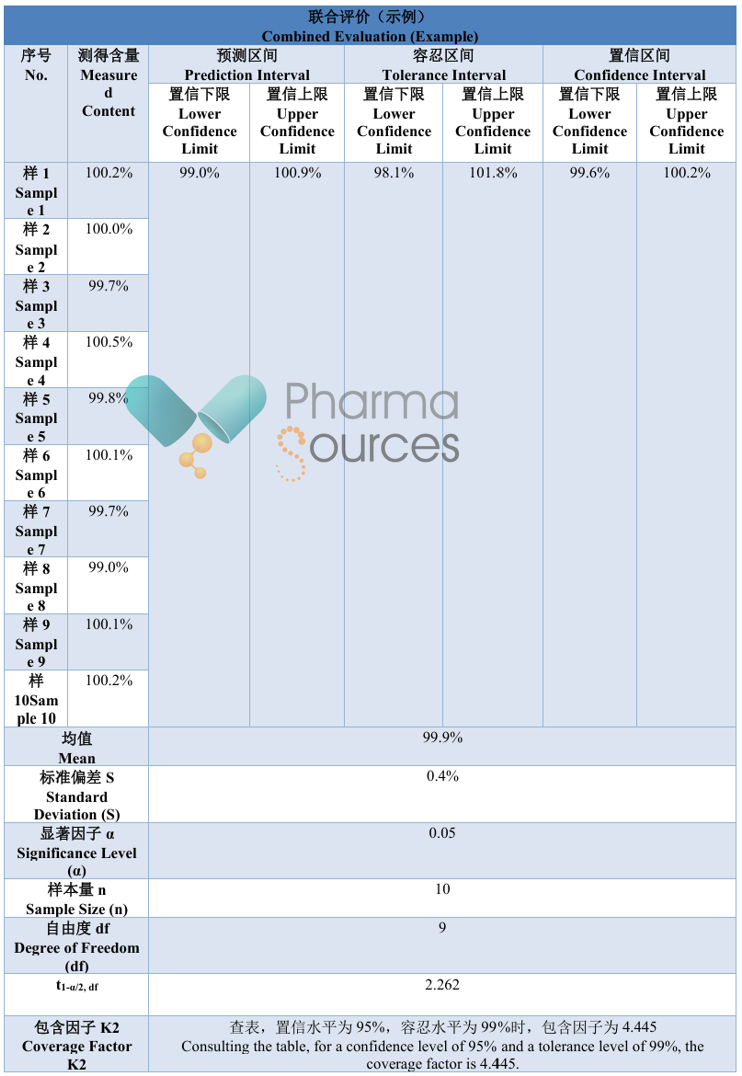
From the statistical results above, it can be seen that the interval ranges obtained by the three different statistical methods differ significantly. The Chinese Pharmacopoeia 2025 states that: One statistical method may not be suitable for all situations. If not applicable, other statistical methods can be used to evaluate the method validation results. So, which statistical method should be followed in practical application?
The author believes that analytical method validation based on statistics essentially characterizes the overall performance of the method through validation and uses this to predict future risks in quality control. This approach is more scientific but places higher demands on the test samples used for analytical method validation, because the reliability of statistical results is closely related to the sample size. An excessively small sample size may lead to overly wide statistical intervals, rendering them meaningless for practical decision-making. However, a sufficient sample size requires higher test costs for an enterprise. Typically, the validation sample size is <20. Considering the sensitivity of statistical methods to sample size comprehensively, it is recommended to prioritize the "prediction interval", followed by the "confidence interval".
Note: Despite the author's best endeavors, limitations may remain in this article. Constructive criticism and feedback are highly appreciated.
[1] 9101 Guidelines for Validation of Analytical Methods
[2] 9097 Guidelines for Interpretation and Processing of Analytical Data


Contact Us
Tel: (+86) 400 610 1188
WhatsApp/Telegram/Wechat: +86 13621645194
+86 15021993094
Follow Us:


 Pharma Sources Insight July 2025


